I Built a Personal Bloomberg Terminal — For Free, On My Home Server
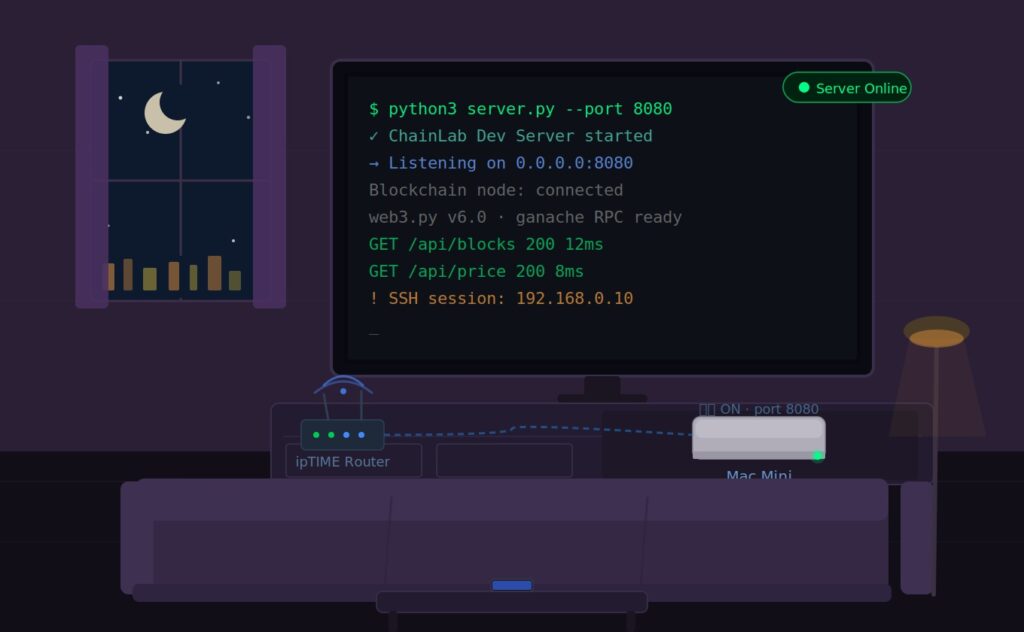
Korean stocks, US markets, macro indicators, crypto, forex, news, and Trump’s latest moves — Running on a Mac Mini in my living room. Monthly cost: $0.
I’ve always been the kind of person who has five financial apps open at once. One for Korean stocks, one for US markets, another for crypto, and a browser tab permanently open for news. It was exhausting.
So one weekend, I decided to just build my own. What started as a simple stock chart viewer turned into something I now genuinely use every day — a personal dashboard that shows everything I care about, accessible from anywhere in the world, updating automatically.
Here’s what I built and how.
What’s On The Screen
Scroll from top to bottom, and here’s what you see:
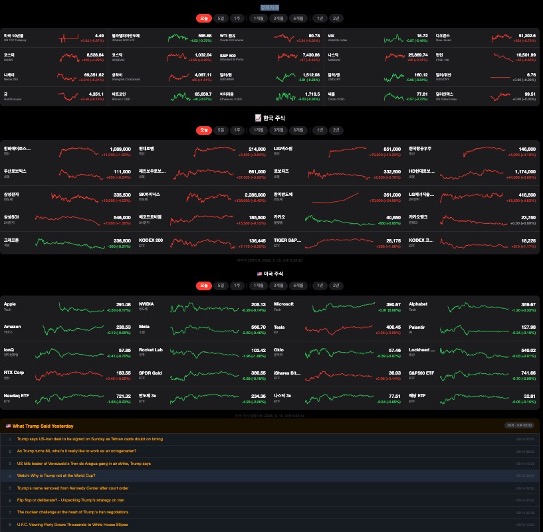
1. Macro Indicators (4×5 Grid)
Twenty global indicators in a tight grid — US 10-year Treasury yield, Philadelphia Semiconductor Index (SOXX), WTI crude oil, VIX volatility index, Dow Jones, KOSPI, KOSDAQ, S&P 500, Nasdaq, FTSE 100, Nikkei, Shanghai Composite, USD/KRW, USD/JPY, USD/CNY, Gold, Bitcoin, Ethereum, Circle (CRCL), and the Dollar Index. Each card shows a mini sparkline chart, current value, and daily change. Period buttons (Today / 5D / 1W / 1M / 3M / 6M / 1Y / 2Y) let you switch the chart timeframe for all 20 at once.
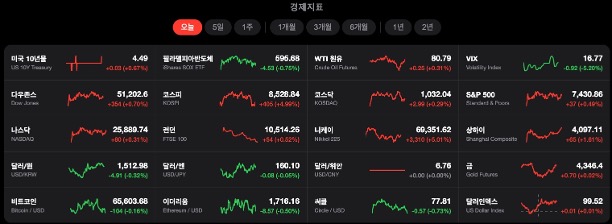
2. Korean Stocks (4×5 Grid)
Twenty Korean stocks I’m watching — defense, robotics, semiconductors, batteries, fintech, and ETFs. Apple Stocks-style layout: company name on the left, mini chart in the middle, price and change on the right.
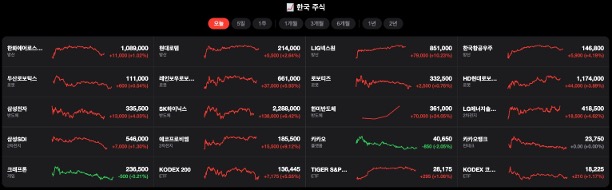
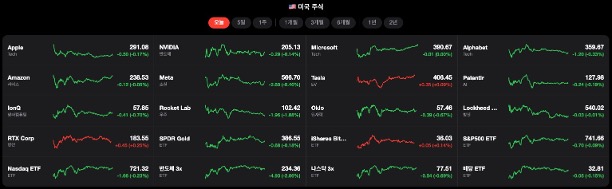
3. US Stocks (4×5 Grid)
Same layout, 20 US names: Apple, NVIDIA, Microsoft, Google, Amazon, Meta, Tesla, Palantir, IonQ, Rocket Lab, Oklo, Lockheed Martin, RTX, and a mix of ETFs (GLD, IBIT, SPY, QQQ, SOXL, TQQQ, SCHD).
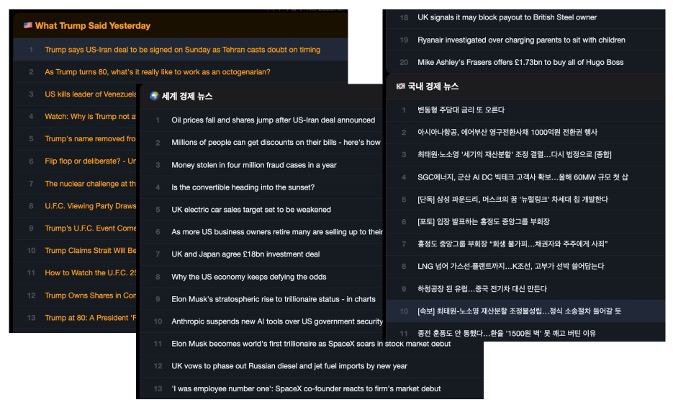
4. News Tables (3 Sections)
- 🇺🇸 What Trump Said Yesterday — BBC, NYT, CNBC filtered for Trump/White House content
- 🌍 World Economy News — BBC Business, CNBC, NYT Business
- 🇰🇷 Korean Economy News — 한국경제, 매일경제, 서울경제
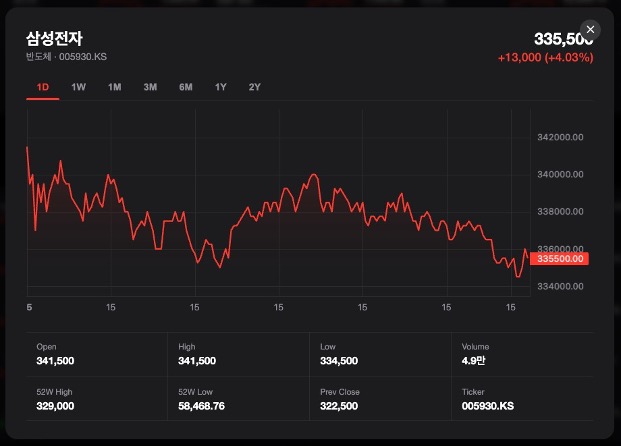
Click any stock card and a modal pops up with a full-size chart, 7 time period tabs (1D to 2Y), and stats: Open, High, Low, Volume, 52W High/Low, Prev Close.
The Tech Stack
Deliberately minimal:
Backend:   Python 3 (stdlib only + yfinance)
Frontend:  Vanilla HTML + JavaScript
Charts:    TradingView lightweight-charts v4 (free)
Data:      Yahoo Finance via yfinance
News:      RSS feeds parsed with urllib + regex
Hosting:   Mac Mini at home, port-forwarded
Three files. That’s it:
stock-dashboard/
├── server.py                  # Python HTTP server + all APIs
├── kr_stocks_dashboard.html   # Entire frontend (HTML/CSS/JS)
└── stocks.csv                 # Your watchlist
The CSV-Driven Watchlist
Stock tickers live in a CSV file, not hardcoded in JavaScript:
ticker,name,sector,market
005930.KS,삼성전자,반도체,KR
000660.KS,SK하이닉스,반도체,KR
AAPL,Apple,Tech,US
NVDA,NVIDIA,반도체,US
CRCL,Circle,Fintech,US
The server reads this on every /api/stocks request. The frontend fetches it on load and splits into KR and US grids automatically. To add or remove a stock, you edit one line in a CSV — no code changes needed.
The API Design
The server exposes three endpoints:
GET /api/stocks              → reads stocks.csv, returns full list
GET /api/stock?ticker=AAPL&period=1d  → price history + change
GET /api/news?category=global         → parsed RSS headlines
The stock endpoint tries multiple intervals before giving up:
FETCH_PLAN = {
    '1d':  [('2m', 5), ('5m', 3), ('1m', 5), ('60m', 2)],
    '5d':  [('30m', 3), ('60m', 2), ('1d', 2)],
    ...
}
If period=1d returns fewer than 5 data points (which Yahoo Finance sometimes does for Korean stocks during certain hours), it falls back to 5d, then 1mo. Each response includes actualPeriod so the frontend can note when it’s showing fallback data.
The Tricky Parts
^VIX, ^GSPC, ^IXIC — Special Characters in URLs
Tickers with ^ break URL parsing. The fix is two lines:
- Frontend:
encodeURIComponent(ticker)before fetching - Backend:
unquote(ticker)when parsing the query string
RSS Feeds + SSL
Python’s feedparser library silently failed on some sites’ SSL certificates. I replaced it entirely with urllib + a custom SSL context, and wrote a small regex-based XML parser. Crude, but it works reliably.
Yahoo Finance Intraday Data
On Korean market hours, yfinance sometimes returns 1–2 data points for period=1d. The multi-interval fallback chain handles this, but it added a lot of debugging time before I figured out the pattern.
External Access
Binding to localhost keeps the server local. Changing to 0.0.0.0 and adding a port-forwarding rule on the router makes it reachable from anywhere. One line change, big difference.
Responsive Layout
The 4×5 grids reflow automatically:
- 1300px+: 5 columns (macro indicators)
- 900px+: 4 columns
- 780px+: 3 columns
- 480px+: 2 columns
- Under 480px: 1 column
Installing It
pip3 install yfinance
# Put server.py, kr_stocks_dashboard.html, stocks.csv in one folder
python3 server.py
# Open http://localhost:8888
For external access, change localhost to 0.0.0.0 in server.py and set up port forwarding on your router.
What I’d Add Next
- Price alerts — notify when a stock moves more than X%
- Portfolio P&L tracking — enter holdings, see total gain/loss
- Scheduled news summary — morning briefing via email
- Authentication — simple token to lock external access
Running on a Mac Mini in my living room. Monthly cost: $0.
If this was useful, give it a clap. If you build your own version, I’d love to see it. 🚀
